Environmental Load of Business Activities
The depletion of energy resources, global warming, threats to biodiversity and other environmental problems are having an increasingly serious impact on the global environment. Given these situations, the SUMCO Group (Japan) identifies forms of energy such as electric power, chemical substances, waste products, and wastewater as significant environmental aspects in its production activities. And we pursue initiatives to consider the environment and reduce environmental load across all of our business activities.
Business Activities and Environmental Load in 2024 (SUMCO Group [Japan])

(remark)
Underlined items are subject to third-party verification.
Figures are rounded to the nearest whole number, so the total of the breakdown and the total value shown may differ.
Additionally, data of High-Purity Silicon Corporation has been incorporated since 2024.
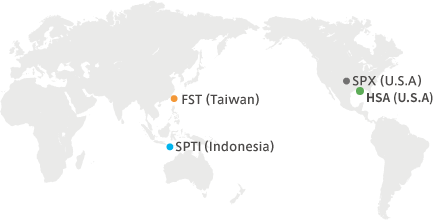
List of Boundaries
| Site | Energy usage |
GHG emissions |
Water used/ wastewater |
Industrial waste generated |
VOC emissions |
PRTR emissions |
Atmospheric pollutant emissions |
Abbreviation | |
|---|---|---|---|---|---|---|---|---|---|
| Includes SUMCO Group companies in Japan |
Kyushu Factory (Nagahama, Imari) | ○ | ○ | ○ | ○ | ○ | ○ | ○ | SUMCO |
| Kyushu Factory (Kubara, Imari) | ○ | ○ | ○ | ○ | ○ | ○ | ○ | ||
| Kyushu Factory (Saga) | ○ | ○ | ○ | ○ | - | - | ○ | ||
| Yonezawa Plant | ○ | ○ | ○ | ○ | ○ | ○ | - | ||
| Chitose Plant | ○ | ○ | ○ | ○ | - | - | - | ||
| JSQ Division | ○ | ○ | ○ | ○ | - | ○ | ○ | ||
| SUMCO TECHXIV Corp. Nagasaki Plant | ○ | ○ | ○ | ○ | ○ | ○ | ○ | STC | |
| SUMCO TECHXIV Corp. Miyazaki Plant | ○ | ○ | ○ | ○ | - | ○ | ○ | ||
| SUMCO Technology Corp. Noda Plant | ○ | ○ | ○ | ○ | - | ○ | ○ | STEC | |
| High-Purity Silicon Corporation | ○ | ○ | ○ | ○ | ○ | ○ | ○ | HSJ | |
| SUMCO Group Companies Overseas |
SUMCO Phoenix Corporation | ○ | ○ | ○ | ○ | - | - | ○ | SPX |
| PT. SUMCO Indonesia | ○ | ○ | ○ | ○ | - | - | ○ | SPTI | |
| FORMOSA SUMCO TECHNOLOGY CORPORATION | ○ | ○ | ○ | ○ | - | - | ○ | FST | |
| High-Purity Silicon America Corporation | ○ | ○ | ○ | ○ | - | - | ○ | HSA | |
| SUMCO Europe Sales Plc | ○ | ○ | - | - | - | - | - | SES | |
| SUMCO Singapore Pte.Ltd. | ○ | ○ | - | - | - | - | - | SSGP | |
| SUMCO Taiwan Technology Corporation | ○ | ○ | - | - | - | - | - | STWN |
- Including all Japan and overseas sites.
- Since 2024, High-Purity Silicon Corporation and High-Purity Silicon America Corporation have been included in the boundaries.
Environmental Load (SUMCO Group / domestic)
GHG emissions (domestic) (thousand tons-CO2e per year)


Water consumption (domestic) (Mm3 per year)


Environmental Load (SUMCO Group / overseas)
GHG emissions (overseas) (thousand tons-CO2e per year)


Water consumption (overseas) (Mm3 per year)


- Since 2024, the GHG emission factors of the overseas affiliates have been based on either local emission factors or the International Energy Agency (IEA) Emission Factors.
Environmental Data (SUMCO Group / domestic and overseas)
GHG Emissions Data
(thousand tons-CO2e per year)
| Calculation Method | 5 years prior (2020) |
4 years prior (2021) |
3 years prior (2022) |
2 years prior (2023) |
Last year (2024) |
|
|---|---|---|---|---|---|---|
| Scope 1 (Direct) |
Conventional | 25 | 27 | 28 | 33 | - |
| SBT-compliant*1 | - | - | - | 86 | 84 | |
| Scope 2 (Indirect) |
Conventional | 765 | 812 | 765 | 942 | - |
| SBT-compliant*1 | - | - | - | 1,194 | 1,097 | |
| Scope 3 (Other) |
Conventional | 694 | 758 | 882 | 1,133 | - |
| SBT-compliant*1 | - | - | - | 1,769 | 1,732 | |
| Scope 1&2 | Conventional | 790 | 839 | 793 | 975 | - |
| SBT-compliant*1 | - | - | - | 1,280 | 1,181 | |
| Scope 1, 2&3 | Conventional | 1,484 | 1,597 | 1,675 | 2,109 | - |
| SBT-compliant*1 | - | - | - | 3,049 | 2,914 |
- For the 2023 calculation, we have added the SBT-compliant calculation methods. From 2024 onwards, we disclose the results using SBT-compliant calculation methods.
(remark)
Figures are rounded to the nearest whole number, so the total of each Scope and the total value shown may differ.
Greenhouse Gas Emissions Scope3 Data (SUMCO Group / domestic and overseas)
(thousand tons-CO2e per year)
| Category | 2024 | ||
|---|---|---|---|
| Domestic | Overseas | ||
| 1 | Purchased goods and services | 696 | 138 |
| 2 | Capital goods | 290 | 13 |
| 3 | Fuel- and energy-related activities not included in Scope 1 or Scope 2 | 150 | 65 |
| 4 | Upstream transportation and distribution | 78 | 21 |
| 5 | Waste generated in operations | 18 | 1 |
| 6 | Business travel | 5 | 1 |
| 7 | Employee commuting | 19 | 5 |
| 8 | Upstream leased assets | Not applicable | Not applicable |
| 9*1 | Downstream transportation and distribution | 2 | 6 |
| 10*1 | Processing of sold products | 115 | 61 |
| 11 | Use of sold products | Not applicable | Not applicable |
| 12*1 | End-of-life treatment of sold products | 25 | 16 |
| 13 | Downstream leased assets | Not applicable | Not applicable |
| 14 | Franchises | Not applicable | Not applicable |
| 15*1 | Investments | 5 | 0 |
- Categories 9,10,12, and 15 were added for SBT certification after 2024.
(remark)
Figures are rounded to the nearest whole number, so the total of the breakdown and the total value shown may differ.
GHG Emissions Data (by Company)
(thousand tons-CO2e per year)
| Calculation Method | 5 years prior (2020) |
4 years prior (2021) |
3 years prior (2022) |
2 years prior (2023) |
Last year (2024) |
|
|---|---|---|---|---|---|---|
| SUMCO*1 | Conventional | 1,132 | 1,228 | 1,316 | 1,691 | - |
| SBT-compliant*2 | - | - | - | 1,991 | 1,825 | |
| STC | Conventional | 119 | 131 | 120 | 184 | - |
| SBT-compliant*2 | - | - | - | 184 | 164 | |
| HSJ | SBT-compliant*2 | - | - | - | 153 | 155 |
| FST | Conventional | 165 | 165 | 167 | 171 | - |
| SBT-compliant*2 | - | - | - | 360 | 401 | |
| SPX | Conventional | 57 | 60 | 60 | 52 | - |
| SBT-compliant*2 | - | - | - | 95 | 87 | |
| SPTI | Conventional | 12 | 12 | 12 | 11 | - |
| SBT-compliant*2 | - | - | - | 34 | 25 | |
| HAS | SBT-compliant | - | - | - | 230 | 257 |
| Others*3 | SBT-compliant | - | - | - | 0.3 | 0.2 |
| Total | Conventional | 1,484 | 1,597 | 1,675 | 2,109 | - |
| SBT-compliant*2 | - | - | - | 3,049 | 2,914 |
- Domestic Greenhouse Gas Emissions Scope3 is aggregated as "SUMCO".
- For the 2023 calculation, we have added the SBT-compliant calculation methods. From 2024 onwards, we disclose the results using SBT-compliant calculation methods.
- Overseas non-manufacturing sites
(remark)
Figures are rounded to the nearest whole number, so the total of the breakdown and the total value shown may differ.
GHG Data (Scope 1) (SUMCO Group / domestic)
(tons)
| 5 years prior (2020) |
4 years prior (2021) |
3 years prior (2022) |
2 years prior (2023) |
Last year (2024) |
|
|---|---|---|---|---|---|
| CO2 | 25,000 | 27,000 | 28,000 | 31,000 | 25,158 |
| CH4 | - | - | - | - | - |
| N2O | - | - | - | - | - |
| HFC | 0.006 | 0.014 | 0.014 | 1.7 | 1.5 |
| PFC | - | - | - | 0.048 | 0.048 |
| SF6 | - | - | - | 0 | 0.001 |
| NF3 | - | - | - | - | - |
- Figures are rounded to the nearest whole number, so the total of the breakdown and the total value shown may differ.
Energy Consumption(SUMCO Group / domestic and overseas)
| 5 years prior (2020) |
4 years prior (2021) |
3 years prior (2022) |
2 years prior (2023) |
Last year (2024) |
|
|---|---|---|---|---|---|
| Electricity usage (GWh) | 1,792 | 1,877 | 1,963 | 1,899 | 2,462 |
| Electricity (converted to petroleum) (kL) | 451,085 | 472,505 | 494,290 | 478,178 | 548,868 |
| Fuel (converted to petroleum) (kL) | 8,804 | 9,670 | 10,103 | 10,868 | 27,872 |
| Steam (converted to petroleum) (kL) | - | - | - | 1,561 | 16,553 |
Water Supplied (SUMCO Group / domestic and overseas)
(Mm3 per year)
| 5 years prior (2020) |
4 years prior (2021) |
3 years prior (2022) |
2 years prior (2023) |
Last year (2024) |
|
|---|---|---|---|---|---|
| Surface water (rivers, wetland, natural lakes) | 14.8 | 15.7 | 17.3 | 17.9 | 20.5 |
| Water underground (well water) | 3.2 | 3.5 | 3.8 | 4.1 | 4.4 |
| Quarry water | - | ― | - | - | - |
| Potable water | 1.1 | 1.3 | 1.3 | 1.2 | 1.6 |
| External drainage | - | ― | - | - | - |
| Rainwater | - | ― | - | - | - |
| Seawater | - | ― | - | - | - |
| Total | 19.1 | 20.5 | 22.4 | 23.2 | 26.5 |
Water Supplied (by Company)
(Mm3 per year)
| 5 years prior (2020) |
4 years prior (2021) |
3 years prior (2022) |
2 years prior (2023) |
Last year (2024) |
|
|---|---|---|---|---|---|
| SUMCO | 10.4 | 11.1 | 12.7 | 13.0 | 13.4 |
| STC | 4.2 | 4.6 | 4.8 | 5.2 | 5.5 |
| HSJ | - | - | - | - | 1.3 |
| FST | 2.8 | 3.0 | 3.0 | 3.2 | 4.0 |
| SPX | 1.3 | 1.4 | 1.5 | 1.4 | 1.4 |
| SPTI | 0.4 | 0.4 | 0.4 | 0.4 | 0.3 |
| HSA | - | - | - | - | 0.7 |
| Total | 19.1 | 20.5 | 22.4 | 23.2 | 26.5 |
- Please refer the page of "Effective Use of Water Resources" for water-stressed area.
Drainage Water(SUMCO Group / domestic and overseas)
(Mm3 per year)
| 5 years prior (2020) |
4 years prior (2021) |
3 years prior (2022) |
2 years prior (2023) |
Last year (2024) |
|
|---|---|---|---|---|---|
| Total water drained into the ocean | 8.6 | 9.1 | 10.3 | 10.7 | 11.9 |
| Total water drained to surface water sources | - | - | - | - | - |
| Total water drained to underground sources / well water sources | - | - | - | - | - |
| Total water drained outside of plants | 4.7 | 4.8 | 5.1 | 5.4 | 5.9 |
| Other drainage water | 3.1 | 3.5 | 3.5 | 3.4 | 3.8 |
| Total drainage water | 16.4 | 17.4 | 18.9 | 19.5 | 21.6 |
Drainage Water (by Company)
(Mm3 per year)
| 5 years prior (2020) |
4 years prior (2021) |
3 years prior (2022) |
2 years prior (2023) |
Last year (2024) |
|
|---|---|---|---|---|---|
| SUMCO | 8.9 | 9.6 | 10.8 | 10.8 | 11.1 |
| STC | 3.7 | 4.0 | 4.2 | 4.5 | 4.8 |
| HSJ | - | - | - | - | 0.8 |
| FST | 2.3 | 2.3 | 2.3 | 2.7 | 3.0 |
| SPX | 1.1 | 1.1 | 1.2 | 1.2 | 1.3 |
| SPTI | 0.4 | 0.4 | 0.4 | 0.3 | 0.3 |
| HSA | - | - | - | - | 0.3 |
| Total | 16.4 | 17.4 | 18.9 | 19.5 | 21.6 |
VOC emissions (SUMCO Group / domestic)
(tons per year)
| 5 years prior (2020) |
4 years prior (2021) |
3 years prior (2022) |
2 years prior (2023) |
Last year (2024) |
|
|---|---|---|---|---|---|
| VOC | 8.4 | 11.3 | 10.3 | 5.5 | 4.9 |
- Chemical Substances have been tabulated based on the PRTR system of the Ministry of Economy, Trade and Industry since 2021.
CDP
SUMCO has been recognized by the international NGO “CDP*1” for its efforts in climate change and water security, and in 2024, we were included in the CDP's Water A List*2, recognizing us as one of the highest performing companies in the area of water resource management.
2024 CDP Scores
Climate Change : A-
Water Security : A
In 2025, we responded to two questionnaires on climate change and water security. Please refer to the PDF below for each answer from SUMCO.
- An international NGO that works in the environmental field. They send environmental questionnaires to companies and compile the results and analyze and evaluate them on a common scale.
- The rating system is a 5-rank scale (A, A-, B, B-, C, C-, D, D-, F). The A List is made up of the companies awarded the highest performance rank of "A".
Third Party Verification of GHG Emissions (SUMCO Group / domestic)
We have conducted third-party verification in accordance with ISO14064-3 for Scope 1, 2, and 3 (Categories 1, 2, and 3) to improve the reliability of the calculation results for GHG emissions of the SUMCO Group (Japan), and obtained a verification report.
-

-
In order to view PDF files, you must have the Adobe® Reader™ plug-in offered free of charge from Adobe Systems, Inc.